The Evolving Landscape of U.S. Residential Solar Energy
The United States solar industry is at a pivotal juncture, characterized by unprecedented overall growth coexisting with significant challenges in key market segments. While the deployment of solar technology is reshaping the nation’s energy supply at a historic pace, a closer examination reveals a complex and bifurcated market. The utility-scale sector is experiencing a period of explosive expansion, driven by federal policy and improving supply chains. In stark contrast, the residential solar sector, the face of distributed energy for millions of Americans, is navigating a period of sharp contraction due to macroeconomic pressures and shifting state-level policies. This section deconstructs these divergent trends, analyzes their geographic and policy drivers, and establishes the foundational context for the evolving role of solar energy in the American home.
Market Trajectory: Growth, Recent Contraction, and Long-Term Outlook
On an aggregate level, the U.S. solar market continues to set records. In the third quarter of 2024, the industry installed 8.6 gigawatts-direct current (GWdc) of capacity, contributing to a projected annual total exceeding 40 GWdc.1 For the full year 2024, total installations reached nearly 50 GWdc, a remarkable 21% increase over 2023. This surge has solidified solar’s position as the dominant source of new electricity generation, accounting for approximately 64% to 66% of all new capacity added to the U.S. grid.1
However, these headline figures obscure a critical downturn in the consumer-facing portion of the market. The residential solar segment is undergoing a significant recession, with installations projected to contract by 26% to 32% in 2024 compared to the previous year.1 This marks the segment’s lowest annual installed capacity since 2021.2 The downward trend, which began in late 2023, persisted into the first quarter of 2025, which recorded a 13% year-over-year decline in residential installations.3
Despite these near-term headwinds for the residential market, long-term projections remain broadly optimistic. The Solar Energy Industries Association (SEIA) forecasts that cumulative U.S. solar capacity will more than triple, expanding from 236 GWdc at the end of 2024 to 739 GWdc by 2035.2 This aligns with projections from the U.S. Energy Information Administration (EIA), which anticipates that renewable sources will supply nearly half of the world’s electricity by 2050.4 Nevertheless, the industry’s growth trajectory over the next five years is expected to be modest, constrained by persistent power sector challenges, including labor availability, high-voltage equipment shortages, and significant interconnection delays.1
A Tale of Two Sectors: Contrasting Residential and Utility-Scale Growth
The current state of the U.S. solar market is best understood as a tale of two distinct sectors moving in opposite directions. The contraction in the residential segment is starkly contrasted by the phenomenal growth of the utility-scale sector. In Q3 2024 alone, utility-scale developers installed 6.6 GWdc of capacity, representing a 44% increase over the same period in the prior year.1 This segment is the sole engine of the industry’s overall positive growth statistics, a fact that has profound implications for policy and investment.
The drivers behind these divergent paths are clear. The residential downturn is primarily a consequence of macroeconomic pressures. Elevated interest rates have substantially increased the cost of financing for homeowners, making solar loans less attractive. This is compounded by broader economic uncertainty, which has dampened consumer demand for large capital investments.1 Conversely, the utility-scale boom is being fueled by a strong pipeline of large-scale projects, the materialization of powerful manufacturing and deployment incentives from the Inflation Reduction Act (IRA), and the resolution of supply chain bottlenecks that had previously caused widespread project delays.1
This bifurcation reveals that the two markets respond to fundamentally different economic and policy signals. Utility-scale solar is highly sensitive to federal industrial policy, corporate power purchase agreements, and global supply chain logistics. The residential market, in contrast, is acutely sensitive to consumer credit conditions, household disposable income, and, most critically, state-level utility compensation rules. An analysis that considers only the aggregate installation numbers would fail to diagnose the significant challenges facing the consumer-facing side of the industry, potentially leading to misguided policy or investment strategies.
Table 1: U.S. Solar Market Installation Capacity by Segment (GWdc), 2023-2024
Market Segment
2023 Installed (GWdc)
2024 Installed (GWdc)
Year-over-Year Change (%)
Residential PV
6.9
4.7
-32%
Commercial PV
1.9
2.1
+8%
Community Solar PV
1.3
1.7
+35%
Utility PV
20.8
31.5
+51%
Total
30.9
49.9
+61%
Note: Data synthesized from multiple market reports.1 Totals and percentages are calculated based on available segment data and may reflect rounding.
Geographic Frontiers: State-Level Leadership and Emerging Markets
The geographic landscape of the U.S. solar market is undergoing a significant transformation. While historically concentrated in a few key states, the market is now broadening, creating new centers of gravity for solar deployment. For years, California has been the undisputed leader, and it still holds the top rank for cumulative installed capacity with over 52 GW, enough to supply more than 31% of the state’s electricity.5 However, the state’s residential sector is facing an acute crisis, with a projected 45% decline in installation volumes in 2024, largely due to changes in its net metering policy.2
As California’s residential market falters, Texas and Florida have emerged as the new powerhouses for solar capacity additions. In the first quarter of 2025, Texas installed 2.7 GWdc of new capacity, a figure 92% higher than that of second-ranked Florida.3 This growth in both states is overwhelmingly dominated by large utility-scale projects.3
This shift is part of a wider trend of market diversification. A decade ago, only three states had surpassed the 1 GW milestone for installed solar capacity. Today, that number has grown to 33 states and Puerto Rico, signaling a robust national expansion.6 States such as Arizona, which benefits from favorable net metering and tax policies, and North Carolina are established leaders rounding out the top five.6 Meanwhile, states like Illinois and Maine are demonstrating significant growth in the commercial and community solar segments, driven by their own supportive policy environments.2 This geographic broadening indicates that while the residential market faces national headwinds, state-level policy remains a powerful determinant of regional market health and growth potential.
The Policy Levers: Analyzing the Impact of the ITC and Net Metering Reforms
Federal and state policies act as the primary levers controlling the velocity and direction of the solar market. At the federal level, the Investment Tax Credit (ITC) has been the cornerstone of solar economics for over a decade. The Inflation Reduction Act of 2022 reinvigorated this incentive, restoring it to 30% for systems installed between 2022 and 2032.8 This credit provides a direct, significant reduction in the upfront cost of a solar installation for homeowners and has been a critical driver of adoption nationwide.
At the state level, however, the policy landscape is far more fragmented and is currently in a state of flux. Net Energy Metering (NEM) policies, which dictate how homeowners are compensated for surplus solar energy exported to the grid, are undergoing significant and often contentious reforms. The most impactful of these has been California’s transition from its NEM 2.0 tariff to a new “net billing” structure. This new policy drastically reduces the compensation rate for exported solar energy, severely weakening the economic proposition for solar-only systems and serving as a primary catalyst for the state’s sharp residential market contraction.2
This policy-driven downturn in California, while a major blow to national installation figures, is also inadvertently accelerating the market’s evolution toward a more resilient, decentralized model. The reduced financial incentive to export power creates a powerful economic driver for homeowners to pair solar panels with battery storage. By storing their excess solar energy for use during evening hours when grid electricity is most expensive, homeowners can maximize their own consumption and insulate themselves from the new rate structure. This dynamic is directly reflected in market data: the national attachment rate for battery storage with new residential solar installations more than doubled from under 12% in 2023 to over 28% in 2024, with California’s policy shift cited as a key driver.7 This indicates that while policies unfavorable to solar-only systems can harm the market, they simultaneously create a potent business case for integrated solar-plus-storage solutions. As other states inevitably move to reform their own NEM policies, this trend is likely to replicate, suggesting that the future of the residential solar industry is inextricably linked to the growth of the home battery storage market.
The Homeowner Value Proposition: A Deep Dive into Solar Economics
Beyond the macroeconomic trends and policy debates, the decision to adopt solar energy is ultimately made at the kitchen table. For the American homeowner, this decision hinges on a complex calculation of costs, savings, and long-term value. While the financial benefits are substantial and well-documented, they are also highly variable, depending on geography, utility rates, and available incentives. Furthermore, a significant gap persists between the quantifiable economic advantages of solar and the public’s perception of its affordability and financial viability. This section provides a granular analysis of the residential solar value proposition, deconstructing system costs, quantifying potential savings, and examining the key motivations and barriers that shape consumer adoption.
Deconstructing the Cost: System Pricing Benchmarks and Component Analysis
The cost of installing a residential solar photovoltaic (PV) system has declined dramatically over the past decade, though prices have seen some recent volatility. According to detailed cost benchmarks from the U.S. Department of Energy (DOE), the Modeled Market Price (MMP) for a representative 8 kWdc residential system in the first quarter of 2024 was 3.15perwatt(/Wdc).9 Transactional data from the EnergySage marketplace, which reflects real-world quotes from installers, shows a slightly lower average cost of approximately $2.53/Wdc to $2.80/Wdc before incentives in 2025.10
For an average-sized 12 kW system, a common size for a U.S. home, this translates to a gross cost of roughly $29,649.11 The 30% federal ITC directly reduces this out-of-pocket expense. After applying the tax credit, the net cost for this average system falls to approximately $20,754.11 This upfront investment is the primary financial hurdle for most potential adopters.
System costs are heavily influenced by global supply chains and trade policy. A significant oversupply of modules on the global market has pushed prices to record lows, around $0.11/Wdc.12 However, U.S. consumers do not fully benefit from these low prices. Due to import tariffs and other factors, the average price for a module in the U.S. remains at a substantial premium, around $0.31/Wdc.10 The IRA includes provisions designed to stimulate domestic solar manufacturing, and a significant increase in U.S.-based production capacity has been announced.2 Over the long term, this onshoring of the supply chain could help stabilize prices and reduce exposure to international trade volatility, though its immediate impact on consumer pricing is still developing.
Quantifying the Savings: National and State-Level Impact on Electricity Bills
The primary financial return from a solar investment comes from the reduction or elimination of a homeowner’s monthly electricity bill. Nationally, the average U.S. household can expect to save approximately $1,500 per year by installing solar panels.14 Over the typical 25-year warrantied life of a solar panel system, these annual savings compound to a total lifetime savings of around $52,000.16
However, these savings are highly dependent on two key local factors: solar irradiance (how much sun a location receives) and, most importantly, the local price of electricity. Consequently, the financial benefits of solar vary dramatically from state to state. The value proposition is strongest in states with high utility rates. For example, the estimated 25-year savings for a homeowner in California, with its high electricity costs, is approximately $124,104, while in Hawaii it can exceed $139,000.15 In contrast, in a state like Washington, which benefits from low-cost hydropower and thus has cheaper electricity, the estimated 25-year savings are significantly lower at around $34,879.16
A standard residential solar array of about 7.15 kW can be expected to produce an average of 965 kilowatt-hours (kWh) of electricity per month.14 This output is greater than the average monthly U.S. household consumption of 886 kWh, meaning that in many parts of the country, a properly sized solar system can offset 100% of a home’s electricity usage. In such cases, the homeowner’s monthly electricity bill can be reduced to just the fixed connection fees charged by the utility, which are typically a small fraction of their previous energy costs.14
The Bottom Line: Calculating Return on Investment and Payback Periods
For homeowners who purchase their systems, solar energy is a long-term investment that generates returns by avoiding future energy costs. The average solar Return on Investment (ROI) in the U.S. is approximately 10% annually, though many homeowners realize returns in the 10% to 30% range, depending on their specific circumstances.17
The payback period—the time it takes for the accumulated energy savings to equal the initial net cost of the system—is a key metric for many consumers. In the U.S., the average payback period for a residential solar system ranges from 9 to 14 years.17 After this break-even point is reached, the electricity generated by the system for the remainder of its 25- to 30-year lifespan is effectively free.
The 30% federal ITC is a critical variable in these calculations. For an average system, the credit provides a tax liability reduction of around $9,000, which can shorten the payback period by several years.11 The impending expiration of the 30% credit for residential systems after December 31, 2025, creates a significant sense of urgency for potential adopters, as the financial viability of an installation will be notably diminished without this substantial federal support.16
Table 2: State-by-State Residential Solar Economic Analysis
State
Average System Cost (After 30% ITC)
Average Electricity Rate ($/kWh)
Estimated Annual Savings
Estimated 25-Year Savings
Estimated Payback Period (Years)
California
$14,254
$0.35
$5,549
$138,716
4 – 6
Texas
$20,191
$0.15
$2,472
$61,794
8 – 10
Florida
$21,482
$0.15
$1,825
$45,629
10 – 12
Arizona
$19,102
$0.16
$2,944
$73,608
6 – 8
Massachusetts
$22,750
$0.30
$2,959
$98,937
7 – 9
New York
$23,437
$0.27
$2,899
$84,817
8 – 10
Colorado
$20,769
$0.16
$2,398
$59,958
8 – 10
Washington
$23,959
$0.14
$1,297
$34,879
15 – 18+
Note: Data synthesized from multiple sources providing cost, rate, and savings estimates.11 Payback periods are estimates and can vary based on system performance and future rate increases.
Beyond the Numbers: Key Motivations and Barriers for Consumer Adoption
While the financial case for solar is robust, consumer adoption is driven by a combination of economic, environmental, and social factors. Research conducted by the National Renewable Energy Laboratory (NREL) provides deep insight into these motivations. Overwhelmingly, financial considerations are the dominant driver. In a comprehensive survey of solar adopters, 78% rated “lowering total electricity costs” as an “extremely important” motivation. This was followed by another financial concern: “protection from rising electricity prices in the future,” which 62% of adopters deemed extremely important.21
Environmental benefits, while significant, are consistently ranked as a secondary motivation. Half of adopters cited “being able to use renewable energy” as extremely important, but this factor rarely superseded the primary goal of saving money.21 This indicates that while consumers value sustainability, the decision to invest in solar is primarily an economic one.
The primary barriers for non-adopters mirror these motivations. The most cited reason for not adopting solar is the perception that it is “not compelling financially,” a view held by 66% of non-adopters who had not seriously considered it.21 This is followed by the inability to afford the upfront cost (35%) and a general lack of trust in the information provided by installers and other sources (49%).21 This reveals a fundamental disconnect. The data clearly demonstrates significant long-term financial benefits, yet the primary barrier to adoption is financial skepticism and the “sticker shock” of the initial investment. The industry’s core challenge, therefore, is not one of inherent value but of effective communication, building trust, and providing accessible financing solutions that can bridge this critical perception gap.
Furthermore, the significant regional disparity in solar savings may create a self-perpetuating cycle that could inadvertently exacerbate energy inequality. States with the highest electricity costs, such as California and Massachusetts, offer the greatest potential for solar savings, making adoption most attractive in those regions.16 This could lead to a future where more affluent households in high-cost states achieve energy independence and benefit from low, stable energy bills, while households in states with currently lower—but still rising—electricity rates are unable to justify the upfront investment. These households would be left behind, fully exposed to future utility rate hikes, potentially widening the gap in energy burden between different socioeconomic groups and geographic regions without targeted policy interventions like expanded community solar or dedicated low-income solar programs.22
The Grid in Transition: Solar Integration, Load Shifting, and the Duck Curve
The rapid proliferation of residential solar systems, while empowering for individual homeowners, presents a profound technical and operational challenge for the 20th-century electrical grid. The grid was architected for a one-way flow of power from large, centralized power plants to passive consumers. The rise of distributed generation, where millions of homes act as small power plants, fundamentally disrupts this model. This disruption is most vividly illustrated by the “duck curve,” a phenomenon that highlights the growing misalignment between when solar energy is produced and when it is most needed. This section examines the nature of the duck curve, the stability challenges it creates for the grid, and the consumer-side strategy of load shifting, which represents a first step toward a more flexible and responsive energy system.
The Duck Curve Phenomenon: How Residential Solar Reshapes Grid Demand
The “duck curve” is a graph of electricity demand over the course of a day that has become the emblematic representation of the challenges of integrating high levels of solar power. The term was first coined by the California Independent System Operator (CAISO), the entity that manages the state’s electrical grid, after analysts observed a distinct, duck-shaped pattern emerging in the state’s daily net load profile.24
The curve plots the net load, which is the total electricity demand on the grid minus the generation from variable renewable sources like solar and wind.24 During the middle of the day, typically from 10 AM to 2 PM, solar panels across the state are producing their maximum output. This massive influx of solar generation serves a significant portion of the daytime electricity demand directly, causing the amount of power needed from the grid—the net load—to plummet. This sharp midday dip forms the deep “belly” of the duck.25
This oversupply of midday solar energy, while seemingly a benefit, creates significant operational problems. It can depress wholesale electricity prices to near zero or even negative levels, disrupting energy markets.26 More critically, it forces large, conventional power plants (like coal, nuclear, or combined-cycle natural gas) to drastically reduce their output or shut down entirely. These plants are not designed to ramp up and down quickly, and operating them at very low output levels can be inefficient and mechanically stressful, increasing operational costs and wear on the equipment.27
The Evening Ramp: Challenges for Grid Stability and Conventional Power
The most acute challenge represented by the duck curve occurs as the sun begins to set. Solar generation rapidly declines, falling to zero after sunset. Simultaneously, residential electricity demand spikes as people return home from work, turn on lights, cook dinner, and use electronics.24 This collision of falling supply and rising demand creates an extremely steep increase in the net load that the grid must serve. This rapid upward slope on the graph forms the “neck” of the duck.26
This “evening ramp” can be immense. In Arizona, for example, evening ramp rates have increased by over 28% since 2020, now exceeding 500 MW per hour.25 To meet this sudden surge in demand, grid operators must rapidly dispatch other forms of generation. This typically involves firing up natural gas “peaker” plants, which are designed to start quickly but are often less efficient and more expensive to operate than baseload power plants.24 This reliance on peaker plants increases overall system costs and emissions.
Furthermore, the sheer speed and magnitude of the ramp can strain the grid’s infrastructure and threaten its stability. If dispatchable generation cannot be brought online fast enough to match the rising demand, it can lead to grid instability, voltage fluctuations, and, in extreme cases, rolling blackouts.28 The duck curve, therefore, is not merely an academic curiosity; it is a real-world operational challenge that grows more severe with each new solar panel connected to the grid. It reveals a fundamental market failure: an abundance of a valuable commodity (clean solar energy) paradoxically creates a system-wide problem because the grid’s infrastructure and market rules were not designed for its variability. The problem is not the solar energy itself, but the inflexibility of the system into which it is being integrated.
Empowering the Consumer: The Strategy and Impact of Residential Load Shifting
One of the most immediate and accessible strategies to mitigate the challenges of the duck curve begins within the home itself, through a practice known as “load shifting.” Load shifting is the simple but powerful concept of strategically rescheduling energy-intensive activities from evening hours to the middle of the day, aligning a household’s electricity consumption with the peak production of its solar panels.29
This strategy is about maximizing the self-consumption of the “free” solar energy a system produces. Every kilowatt-hour of electricity used directly from the solar panels during the day is a kilowatt-hour that does not need to be purchased from the grid at a higher price in the evening.29 Common examples of load shifting include:
Appliance Scheduling: Using timers or smart features to run dishwashers, washing machines, and clothes dryers during midday.
Pool and Spa Equipment: Setting pool pumps and filters, which are significant energy consumers, to operate during peak sunlight hours.
HVAC Pre-Conditioning: Pre-cooling the home in the summer or pre-heating it in the winter during the day, so the HVAC system works less hard during the evening peak.
Electric Vehicle Charging: Charging an EV at home during the day to soak up excess solar generation.
By adopting these practices, homeowners can significantly reduce their reliance on the grid, lower their electricity bills, and contribute to grid stability by reducing the severity of the evening ramp.
Maximizing Self-Consumption: The New Paradigm for Solar Savings
The concept of load shifting is central to a broader paradigm shift in how the value of residential solar is realized. Under older, more generous NEM policies, homeowners were often compensated at the full retail rate for any excess energy they exported to the grid. In this model, the primary goal was to maximize total energy production. However, as utilities across the country reform these policies and reduce export compensation rates, the financial incentive structure is changing.
In the new paradigm, the value of exporting a kilowatt-hour of solar power to the grid is often much lower than the value of avoiding the purchase of a kilowatt-hour from the grid in the evening. This shifts the economic imperative from maximizing production to maximizing self-consumption. Load shifting is the essential behavioral component of this new model. It marks a significant evolution in the role of the residential energy consumer, transforming them from a passive ratepayer into an active participant in managing their energy profile. This behavioral change is the foundational first step toward a more dynamic, transactive, and decentralized energy system. Once a consumer becomes accustomed to actively managing when they use electricity, the conceptual leap to adopting more advanced technologies that automate and enhance this capability—such as battery storage and smart home energy management systems—becomes much smaller.
The Cornerstone of Resilience: The Role of Residential Battery Storage
If load shifting represents the behavioral response to the challenges of solar integration, then residential battery storage is the definitive technological solution. A home battery energy storage system (BESS) directly addresses the fundamental problem of solar’s intermittency by capturing its abundant midday energy for use at any time. This capability is transforming the value proposition of home energy, shifting the focus from simple bill reduction to a more holistic goal of energy resilience, economic optimization, and grid support. As the market for home batteries accelerates, they are becoming the cornerstone of the modern, decentralized home energy ecosystem.
How Home Batteries Work: From Storing Solar to Ensuring Backup Power
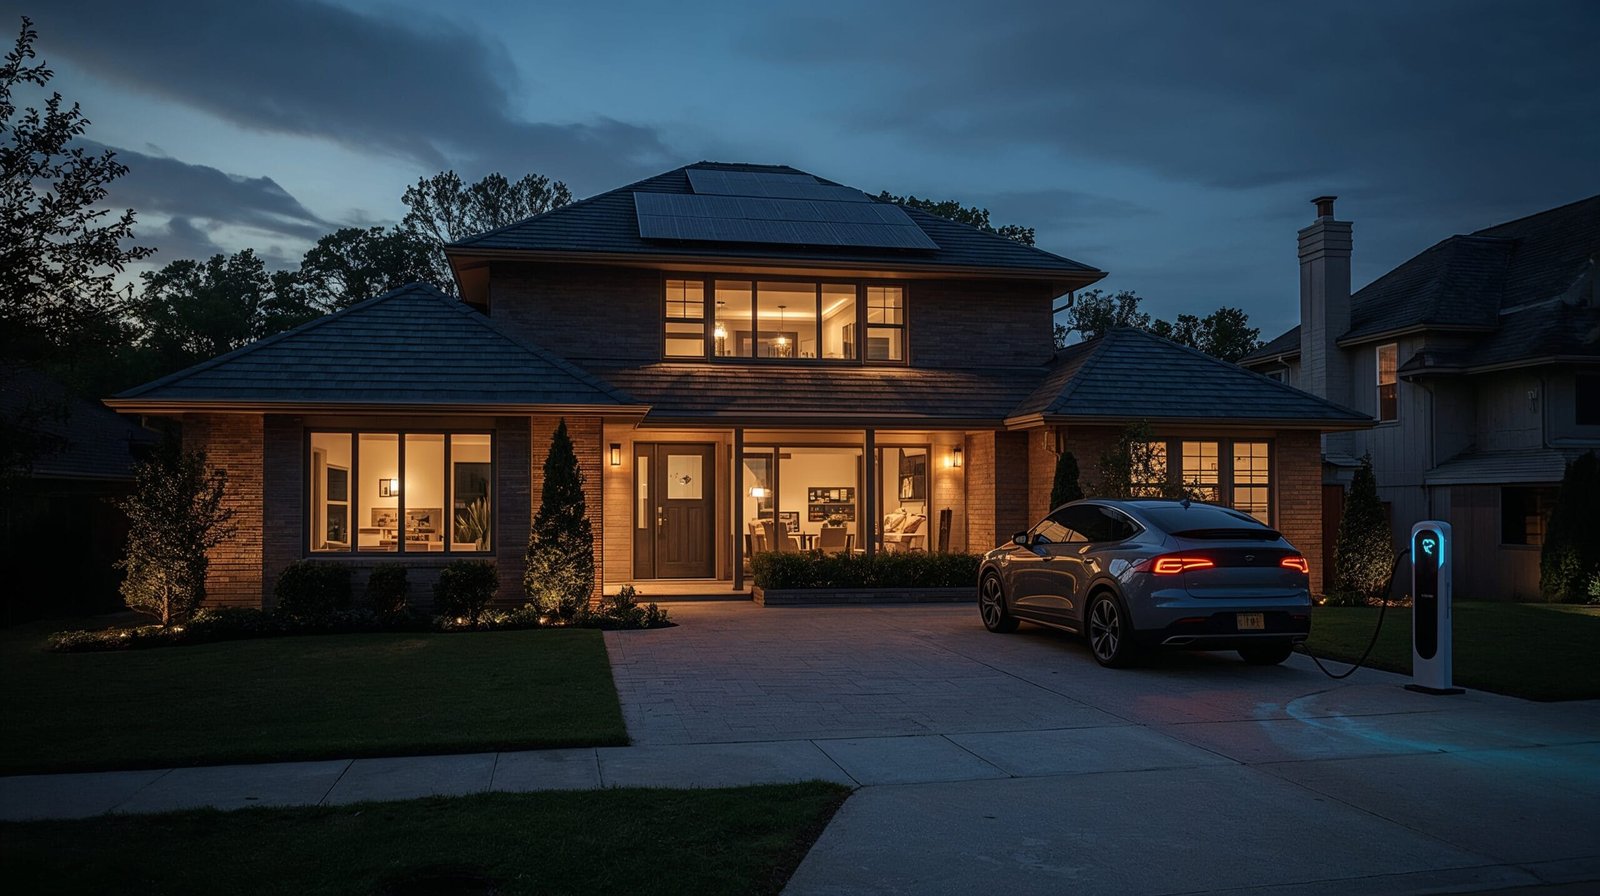
At its core, a home battery system is a rechargeable lithium-ion battery that stores surplus electricity for later use.31 In a solar-plus-storage system, the components work in a coordinated fashion. The solar panels generate direct current (DC) electricity, which flows to an inverter that converts it to the alternating current (AC) used to power the home’s appliances. Any AC electricity generated that is not immediately consumed by the home is used to charge the battery, rather than being exported to the grid.32
When solar production is low or non-existent—at night, on heavily overcast days, or during a power outage—the home seamlessly begins to draw the stored energy from the battery instead of pulling power from the utility grid.31 This ability to store and dispatch energy provides two primary benefits: economic savings and energy resilience.
The most critical function of a home battery is its ability to provide backup power during a grid outage. A standard grid-tied solar system, for safety reasons, must automatically shut down during an outage to prevent it from sending power onto de-energized lines where utility workers may be making repairs. This means that even on a sunny day, a solar-only home will lose power with the rest of the neighborhood.32 A solar-plus-storage system, however, is equipped with a transfer switch that allows it to safely disconnect, or “island,” from the grid during an outage. In this mode, the solar panels can continue to operate safely, powering the home’s essential loads and recharging the battery, creating a self-sufficient personal microgrid that can provide sustained power for hours or even days.33 A typical 10 kWh home battery can power critical appliances like a refrigerator, lights, and communication devices for 10 to 12 hours on a single charge.31
Market Acceleration: Analyzing Battery Adoption, Attachment Rates, and Key Players
The U.S. residential battery storage market is in a phase of explosive growth. Market analysts project the market will expand from approximately $2 billion in 2025 to over $5 billion by 2032, representing a compound annual growth rate (CAGR) of 14.36%.36 This growth is being driven by increasing consumer demand for energy resilience in the face of more frequent extreme weather events and public safety power shutoffs, as well as by the compelling economic case created by utility rate reform.37
A key indicator of this acceleration is the “attachment rate”—the percentage of new residential solar installations that are paired with battery storage. Nationally, this rate has surged dramatically, climbing from less than 12% in 2023 to over 28% in 2024.7 In mature solar markets with advanced rate structures and strong incentives, such as California, the attachment rate for new solar systems is already approaching 40% to 50%.38
The market is currently concentrated among a few established players. Tesla, LG Energy Solution, and Enphase have historically dominated, collectively holding about 80% of the cumulative market share since 2018. However, the competitive landscape is intensifying. As the market expands, new entrants are gaining traction, and the combined market share of the top two legacy players, Tesla and LG, has decreased from 96% in 2018 to 65% in 2023, indicating a more dynamic and competitive environment is emerging.39
Unlocking New Value Streams: Optimizing TOU Rates and Participating in Grid Services
The rise of residential batteries is being driven by a shift in their primary value proposition—from being a luxury “backup power” product to an essential economic optimization tool. This evolution is a direct result of changes in utility rate design. Under Time-of-Use (TOU) billing structures, the price of electricity can vary significantly throughout the day, with rates being much higher during evening “peak” hours. A home battery allows for powerful “rate arbitrage”: the system can be programmed to store abundant, low-cost solar energy during the day and then discharge that energy to power the home during the high-cost evening peak, directly maximizing homeowner savings.33
Similarly, as utilities move away from generous NEM policies, the economic value of exporting surplus solar to the grid diminishes. A battery allows the homeowner to capture the full value of their solar production by storing it for their own use, a strategy of maximizing self-consumption that insulates them from unfavorable export rates.33
Beyond individual savings, home batteries are enabling homeowners to participate directly in energy markets and provide valuable services to the grid. Utilities are increasingly launching “Bring Your Own Battery” (BYOB) programs or aggregating residential batteries into “Virtual Power Plants” (VPPs). In these programs, the utility can pay homeowners for the right to draw power from their batteries during times of extreme grid stress, such as during a summer heatwave. This provides the grid with a fast-acting, clean, and distributed source of emergency capacity, helping to prevent blackouts. For the homeowner, it creates a direct revenue stream, further improving the ROI of their storage investment.33 This aggregation of distributed consumer assets into a dispatchable, utility-scale resource represents a paradigm shift in grid management, blurring the line between the energy consumer and the power plant.
The Financial Case for Storage: Costs, Incentives, and Enhanced ROI
The primary barrier to battery adoption remains the upfront cost. A 5-kW power/12.5-kWh energy capacity battery system involves a significant capital expenditure, though costs are projected to decline steadily due to manufacturing scale and technological improvements.41 In 2025, a typical 13.5 kWh battery costs approximately $9,800 after applying the federal tax credit.33
Crucially, under the IRA, battery storage systems with a capacity of 3 kWh or more are eligible for the 30% federal ITC, even if they are not paired with solar panels.33 This incentive dramatically improves the financial case for storage by directly reducing the initial investment. However, like the credit for solar, the 30% ITC for residential batteries is scheduled to expire after December 31, 2025, creating a powerful near-term incentive for adoption.33
In addition to the federal credit, many states and utilities offer their own incentives. California’s Self-Generation Incentive Program (SGIP), for example, provides substantial rebates that can further reduce or, in some cases for low-income households in high-fire-threat areas, completely cover the cost of a battery system.33 The business case for storage is therefore not a single calculation but a “stack” of potential benefits, the value of which depends on the interplay of federal policy, state incentives, and local utility rate structures.
Table 3: Value Streams for Residential Solar+Storage Systems
Value Stream
Description
Primary Driver
Estimated Financial Impact
Increased Self-Consumption
Storing excess solar energy for later use instead of exporting it to the grid for low compensation.
NEM Reform / Low Export Rates
High; avoids purchasing expensive grid power.
Time-of-Use Rate Arbitrage
Charging the battery with low-cost solar or off-peak grid power and discharging during high-cost peak hours.
Time-of-Use (TOU) Utility Rates
High; directly offsets the most expensive electricity.
Backup Power / Resilience
Providing power to the home during a grid outage, enabling the solar system to continue operating.
Grid Instability / Weather Events
High (Value of Averted Losses); provides energy security.
Demand Charge Reduction
Using the battery to lower the household’s peak draw from the grid during any given period.
Residential Demand Charges
Moderate to High; directly reduces a specific bill component.
Grid Services (VPP/BYOB)
Earning payments from the utility for allowing them to draw power from the battery during grid emergencies.
Utility Demand Response Programs
Moderate; provides a direct revenue stream.
Note: Financial impact is qualitative and depends heavily on local utility rates, incentives, and program availability. Data synthesized from.31
The Next Frontier: Vehicle-to-Grid (V2G) Integration
As solar and stationary battery storage redefine the relationship between the home and the grid, a third technology is emerging with the potential to catalyze an even more profound transformation: the electric vehicle (EV). With batteries far larger than a typical home storage system, the rapidly growing fleet of EVs in the U.S. represents a massive, mobile, and largely untapped energy resource. Vehicle-to-Grid (V2G) integration is the concept of harnessing this resource, enabling EVs to not only consume electricity but also to provide it back to the grid. This section explores the immense promise of V2G, provides a realistic assessment of the formidable technological and regulatory hurdles that currently limit its deployment, and examines the pilot programs that are paving the way for its future.
The EV as a Grid Asset: Understanding Bidirectional Charging and V2G Capabilities
Standard EV charging is a one-way street: power flows from the grid into the vehicle’s battery. Vehicle-to-Grid technology fundamentally changes this dynamic by enabling bidirectional power flow.43 Using a specialized bidirectional charger and a V2G-capable vehicle, a parked and plugged-in EV can discharge a portion of its stored energy back into the electrical system when needed.45 This effectively transforms the EV’s battery—which can hold 100 kWh or more, several times the capacity of a typical home battery—into a powerful, mobile grid asset.47
V2G is the broadest application of a suite of “Vehicle-to-Everything” (V2X) technologies. This includes:
Vehicle-to-Home (V2H): The EV’s battery is used to power the owner’s home, typically during a grid outage. This allows the vehicle to function as a large, mobile backup generator.47
Vehicle-to-Load (V2L): The EV can power individual appliances or tools directly through onboard outlets, useful for worksites or recreational activities where grid power is unavailable.47
Vehicle-to-Grid (V2G): The EV exports power back to the utility grid itself to provide system-wide services.47
While V2H and V2L provide direct benefits to the vehicle owner, V2G is the application with the greatest potential to impact the stability and efficiency of the entire power system.
Potential and Promise: V2G’s Role in Load Balancing and Renewable Integration
The collective battery capacity of the U.S. EV fleet is staggering. With sales of 1.2 million EVs in 2023 and tens of millions projected to be on the road within the next decade, this distributed fleet represents a virtual reservoir of energy storage that dwarfs the capacity of stationary batteries.49 If properly orchestrated, V2G could be a powerful tool for solving the duck curve.
The concept is elegant: millions of EVs, many of which are parked for over 95% of the day, could be programmed to charge during the midday hours when solar energy is abundant and cheap, effectively “soaking up” the surplus generation that forms the duck’s belly.24 Then, during the evening peak demand, these vehicles could discharge a small portion of their energy back to the grid, helping to meet the steep ramp and reducing the need for expensive and polluting peaker plants.50 This coordinated charging and discharging would flatten the net load curve, enhance grid stability, and allow for a much higher penetration of variable renewable energy sources.49 By providing critical grid services like peak load leveling, frequency regulation, and spinning reserves, V2G could help defer or avoid billions of dollars in costly grid infrastructure upgrades.47
A Reality Check: Overcoming Technological, Regulatory, and Infrastructural Hurdles
Despite its immense theoretical potential, the widespread deployment of V2G faces a formidable set of interconnected challenges that span technology, economics, and regulation. The primary barrier is not a single missing component but a massive coordination and standardization challenge across the automotive, energy, and software industries, which have historically operated in separate ecosystems.
Technology and Standards: The foundational hardware for V2G is not yet mainstream. The vast majority of EVs and home chargers currently on the market are unidirectional.43 Furthermore, the industry lacks a universal standard for bidirectional charging. Most current V2G pilot projects rely on the CHAdeMO charging connector, a standard that is being phased out in North America in favor of the CCS and NACS (Tesla) standards, which are still developing their bidirectional capabilities.45
Battery Degradation and Warranties: A primary concern for both consumers and automakers is the potential for V2G’s additional charge and discharge cycles to accelerate battery degradation.47 An EV’s battery is its most expensive component, and its primary purpose is transportation. The fear that using it for grid services could reduce its lifespan or driving range is a major obstacle to consumer acceptance and has made auto manufacturers hesitant to cover V2G use under their warranties.49
Infrastructure and Cost: The existing electrical grid, particularly at the local distribution level, was not designed for large-scale bidirectional power flows from millions of mobile sources. Significant upgrades to transformers, feeders, and control systems would be necessary to manage V2G safely and effectively.43 Additionally, bidirectional chargers are currently more complex and expensive than their standard counterparts.43
Regulation and Compensation: Perhaps the most significant hurdle is the lack of a clear regulatory framework and business model for V2G. It does not fit neatly into existing utility programs like net metering for solar or demand response for stationary batteries. Critical questions remain unanswered: How will vehicle owners be compensated for the grid services they provide? Who is liable if a V2G operation contributes to a grid disturbance? How are the services measured and verified? Without clear rules and established rate structures, utilities are reluctant to integrate V2G into their operations, and consumers have no incentive to participate.43
From Pilot to Practice: Assessing the Current State of V2G Readiness in the U.S.
Given these challenges, V2G in the United States remains almost exclusively in the research, development, and demonstration phase. Its technological and commercial readiness is low, and deployment is limited to a handful of small-scale pilot programs designed to test the technology, gather data, and explore viable business models.
Major utilities are at the forefront of this exploration. Pacific Gas & Electric (PG&E) in California has launched a Vehicle-to-Everything (V2X) pilot that offers customers significant upfront incentives—up to $4,000—to help offset the higher cost of bidirectional charging equipment.51 San Diego Gas & Electric (SDG&E) has partnered with Toyota and Fermata Energy to test V2G capabilities with the Toyota bZ4X, focusing on data collection to inform future rate design and interconnection rules.48
State governments are also sponsoring initiatives. The Massachusetts Clean Energy Center (MassCEC) is running a demonstration program to deploy 50-60 residential and 30-40 commercial bidirectional chargers at no cost to participants to study different use cases.52 In Maine, a pilot program is assessing the feasibility of using electric school buses for V2G services.53 These fleets are a particularly promising near-term application. Unlike privately owned vehicles with unpredictable usage patterns, school buses operate on fixed, predictable schedules. They are typically parked and idle during the midday solar peak and overnight, making them ideal candidates to provide reliable grid services without interfering with their primary transportation mission. The lessons learned and standards developed in these controlled fleet environments will likely be crucial for paving the way for broader residential V2G adoption in the future.
Synthesis and Strategic Outlook
The American home energy landscape is in the midst of a fundamental and accelerating transformation. The siloed, one-way relationship between the passive consumer and the centralized utility is being replaced by a dynamic, interconnected ecosystem of Distributed Energy Resources (DERs). Residential solar, battery storage, and electric vehicles are no longer discrete products but integral components of a sophisticated home energy management system. This report has analyzed the distinct yet interrelated trends shaping this revolution: the bifurcated growth of the solar market, the evolving economic calculus for homeowners, the grid-level challenges posed by renewable intermittency, and the technological solutions poised to address them. This concluding section synthesizes these findings into a cohesive vision for the future and provides strategic recommendations for the key stakeholders who will navigate this new energy paradigm.
The Interconnected Ecosystem: The Symbiotic Relationship Between Solar, Storage, and EVs
The analysis reveals a clear and powerful causal chain driving the evolution of home energy. First, the high penetration of residential solar fundamentally reshapes grid demand, creating the “duck curve” with its midday oversupply and steep evening ramp. Second, this grid challenge, combined with utility policy reforms that devalue solar exports (such as changes to Net Energy Metering), creates a potent economic imperative for homeowners to adopt battery storage. The battery’s primary function becomes maximizing the self-consumption of solar energy and arbitraging Time-of-Use rates, shifting its value proposition from simple resilience to active economic optimization. Finally, the electrification of transportation introduces a massive new fleet of mobile batteries. These EVs, through Vehicle-to-Grid integration, represent the ultimate tool for absorbing surplus renewable generation and providing flexible capacity to the grid, offering a potential long-term solution to the very challenges initiated by solar’s success.
This is a symbiotic relationship. Solar creates the need for storage. Storage unlocks the full value of solar and provides grid stability. EVs offer a future reservoir of storage at an unprecedented scale, which in turn can enable even higher levels of renewable energy integration. Understanding this interconnectedness is critical for developing coherent and effective energy policy and business strategies.
Future Trajectories: Projecting the Path of Home Energy to 2035
Projecting forward, the trends analyzed in this report suggest a clear trajectory for the home energy market over the next decade.
The Normalization of Solar+Storage: By 2030, the pairing of battery storage with new residential solar installations will likely become the default, rather than the exception, in most major U.S. markets. This will be driven by continued utility rate reform, declining battery costs, and a growing consumer desire for energy resilience. The solar-only installation will become a niche product for markets with legacy NEM policies or unique grid conditions.
The Rise of the Energy-Aware Home: The home itself will become an actively managed energy asset. Integrated software platforms, increasingly powered by artificial intelligence, will automate the complex optimization of these DERs. These systems will seamlessly coordinate solar production, battery charge/discharge cycles, and EV charging schedules to minimize costs, maximize self-sufficiency, and participate in grid service programs with minimal input from the homeowner.
The Commercialization of V2G (Fleet-First): While widespread residential V2G will likely remain nascent due to standardization and regulatory hurdles, the next decade will see the first commercial-scale deployments of V2G in managed fleets. Electric school buses, municipal vehicles, and corporate delivery fleets will become the pioneers, proving the technology and business models for providing ancillary services to the grid. The success of these fleet programs will lay the groundwork for the eventual expansion of V2G to the residential sector post-2030.
In-depth Recommendations for Stakeholders
Navigating this transition successfully requires proactive and strategic action from all major stakeholders.
For Policymakers and Regulators:
Design Forward-Looking Rate Structures: Move beyond traditional NEM and design “NEM 3.0” tariffs that explicitly recognize and compensate the value of dispatchable DERs. This includes creating market mechanisms that value services like peak demand reduction, frequency regulation, and resilience, thereby providing clear price signals that encourage investment in storage and V2G.
Standardize Interconnection and Communication: Work with federal agencies, utilities, and industry groups to accelerate the development and adoption of national standards for the interconnection and communication protocols for bidirectional chargers and V2G systems. This is the single most critical step to unlocking the V2G market at scale.
Ensure an Equitable Transition: The benefits of DERs must not be confined to affluent households. Policymakers should expand and fund programs targeted at low- and middle-income (LMI) households, such as dedicated LMI solar incentives, expanded community solar programs that do not require home ownership, and direct rebates for battery storage to reduce energy burden and ensure all communities can participate in and benefit from the clean energy transition.23
For Electric Utilities:
Embrace a New Business Model: The traditional utility model based on selling kilowatt-hours from centralized plants is becoming obsolete. Utilities must transition their business models to become Distribution System Operators (DSOs) and platform managers for a vast network of customer-owned DERs. This involves investing in grid modernization, advanced metering, and control systems to manage a two-way flow of energy and data.
Leverage DERs as a Grid Resource: Instead of reflexively building new peaker plants or transmission lines to meet peak demand, utilities should aggressively pursue “non-wires alternatives” by developing robust VPP and V2G programs. Contracting with aggregations of customer-sited resources can be a faster, cleaner, and more cost-effective way to ensure grid reliability and defer costly capital investments.49
Simplify the Customer Experience: The process for interconnecting solar, storage, and V2G systems is often complex and burdensome for customers. Utilities should streamline their interconnection application and approval processes to reduce soft costs and improve the customer experience, thereby accelerating DER adoption.
For Consumers and the Solar Industry:
Adopt a Holistic Energy Strategy: Homeowners considering solar should evaluate it not as a standalone purchase, but as the foundation of a comprehensive home energy strategy. The decision should incorporate an analysis of local utility rates (especially TOU structures), personal consumption patterns, resilience needs, and future plans to purchase an EV.
Prioritize Education and Trust: The solar and storage industry must address the significant gap between the proven financial value of their products and the prevalent consumer skepticism. This requires a commitment to transparent pricing, clear communication of long-term savings under complex new rate structures, and building a reputation for trustworthiness and high-quality installation.
Future-Proof Installations: Installers should proactively educate customers on the benefits of “storage-ready” solar inverters and electrical panels that can easily accommodate a future battery or bidirectional EV charger. This foresight can save customers significant costs and complexity down the road as their energy needs evolve.
The transition to a decentralized, resilient, and decarbonized home energy system is no longer a distant vision; it is a complex reality unfolding today. While the path forward presents significant challenges, the technological tools and economic drivers are in place to build a more sustainable and equitable energy future, one home at a time.
Suhas Shrikant is the founder of Vecharged and an engineering enthusiast specializing in high-power off-grid solar systems. He has designed and built over a dozen custom systems and uses his hands-on, field-tested experience to create Vecharged’s expert guides and reviews.
Vecharged is the consumer protection and education initiative of Cleanpower.eco, an organization dedicated to providing a clear, unbiased, and authoritative voice in the clean energy transition. The experts at Cleanpower.eco recognized a critical crisis of trust: the shift to electric vehicles and solar power is one of the most important and expensive decisions a family will make. Yet, the landscape is flooded with biased reviews, confusing marketing, and paid-for endorsements. Vecharged was created to be the shield against that confusion. We were founded on a simple, non-negotiable constitution: We are radically independent. We accept no advertising, sponsorships, or paid placements from any product manufacturer. We have no commercial interest in the products we review. Our only metric for success is your empowerment. Our loyalty is to you, the consumer. Full stop. We ground our brutally honest, hands-on analysis in a deep, foundational understanding of the engineering. We are not just reviewers; we are your advocates.
The Hidden Threat to Your Holiday Cheer: Charging Station Chaos By the time you read this, it may already be too late. The Thanksgiving travel surge—the biggest traffic event of the year—is about to hit. Millions of Americans are making the great migration home, and for the growing number of electric vehicle (EV) owners, a
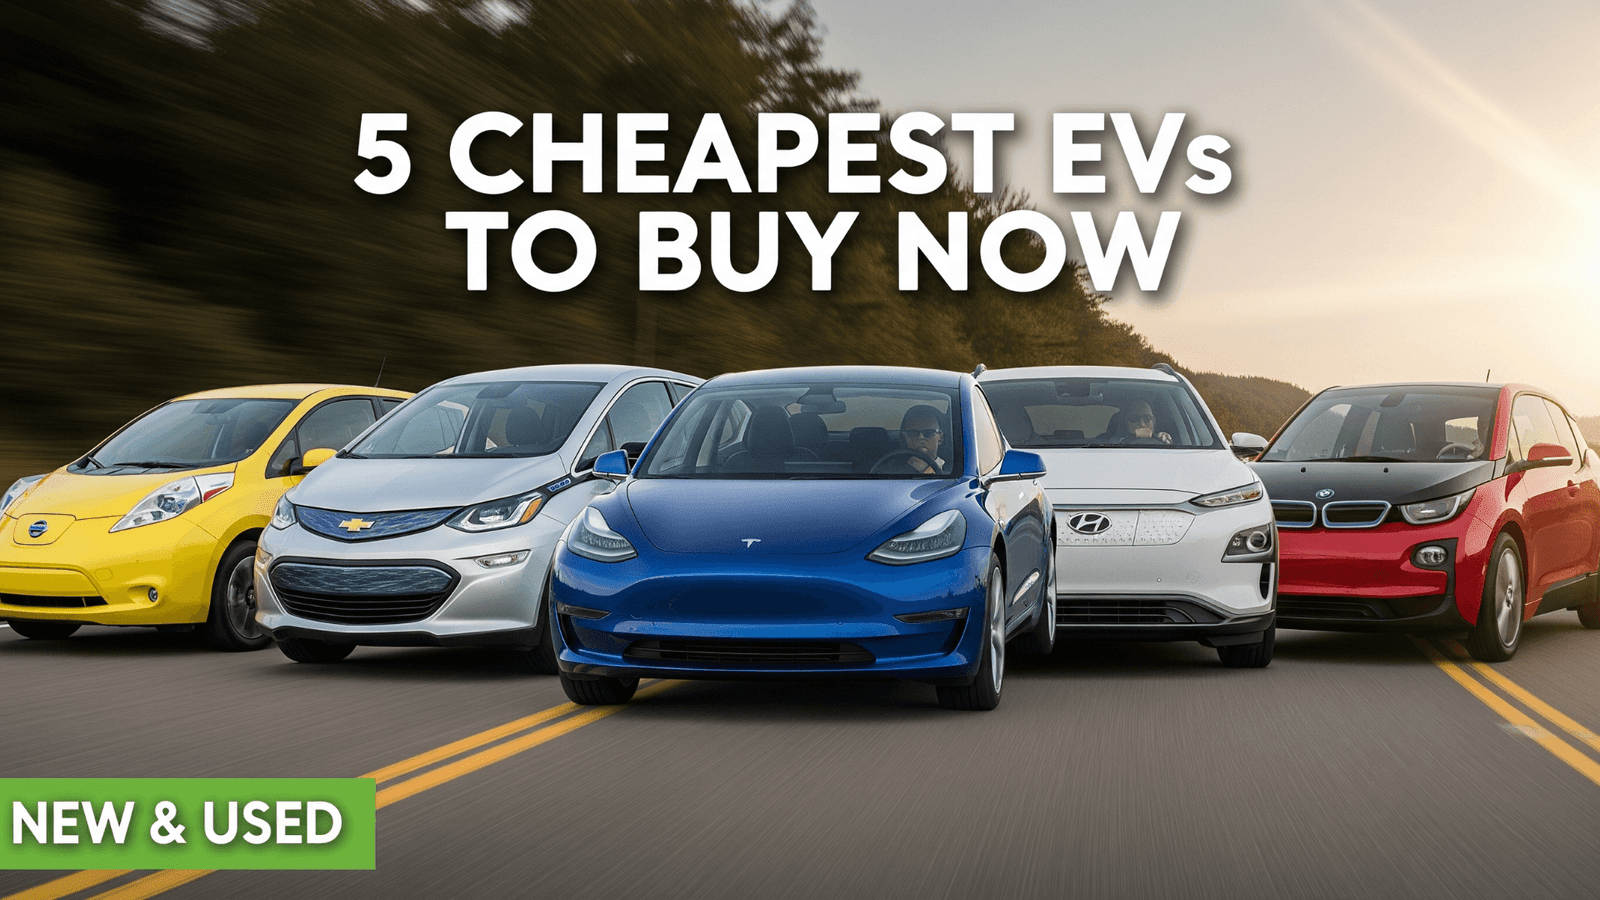
Don’t get fooled by low upfront prices. True EV affordability is measured by battery health, maintenance savings, and long-term Total Cost of Ownership (TCO). The dream of a sub $25,000 electric car is now a reality for savvy buyers—but the cheapest upfront price doesn’t always mean the best value. As a Vecharged expert, I’ve audited
For over a century, the soul of the American motorcycle was forged in sound—the thunderous, chest-thumping rumble of a V-twin engine. It’s the sound of rebellion, of freedom, of the open road. So, when a motorcycle glides past in near-perfect silence, a fundamental question hangs in the air: can that machine, no matter how fast,
For years, the dream has been the same: escaping the city. Trading the noise and the traffic for a quiet piece of land with a mountain view. The fantasy of a self-sufficient life. But for most working professionals, it was always just that—a fantasy. There was a catch, a digital leash that kept us tethered


")
: Understanding the Expenses and Hidden Costs")


[…] Read the full report here: Full Citable Report […]